gaptrast
Member
- Messages
- 123
- Reaction score
- 0
- Points
- 16
Hello,
I have just started a project. This little web application will be used to make planning easier for people living around the clock (specifically those interested in polyphasic sleep).
On the website there will be some input fields where users can write their sleeping times and then it shows up in a visual diagram. The diagram is like a pie or doughnut chart diagram. I will also let users put in other things like work, school, or other organized events. This will hopefully make it easier to see what times are good to choose.
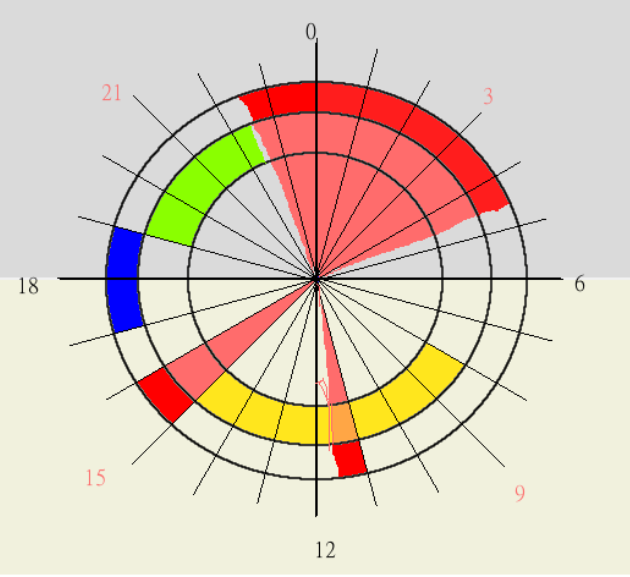
Let me give you an example:

This is a beautifully designed diagram (not made by me though), and that is pretty much how I want the generated charts to look like.
The thing is that I do not really know how to make circles and fancy charts in html and javascript. It must be able to change real-time when the users edit data in the input boxes, and prefferably a way to rotate or drag around the sleeping times.
I have done some research and what I (think I) need is:
What method do you think I should use to achieve this? If I am going to use a charting library, which do you think would fit my needs best?
Thanks
I have just started a project. This little web application will be used to make planning easier for people living around the clock (specifically those interested in polyphasic sleep).
On the website there will be some input fields where users can write their sleeping times and then it shows up in a visual diagram. The diagram is like a pie or doughnut chart diagram. I will also let users put in other things like work, school, or other organized events. This will hopefully make it easier to see what times are good to choose.
Let me give you an example:
This is a beautifully designed diagram (not made by me though), and that is pretty much how I want the generated charts to look like.
The thing is that I do not really know how to make circles and fancy charts in html and javascript. It must be able to change real-time when the users edit data in the input boxes, and prefferably a way to rotate or drag around the sleeping times.
I have done some research and what I (think I) need is:
- Some kind of javascript chart library (http://en.wikipedia.org/wiki/Comparison_of_JavaScript_charting_frameworks) that is customizable and has a doughtnut chart.
- Maybe a own background, and then simply put several pie charts on the top of it?
What method do you think I should use to achieve this? If I am going to use a charting library, which do you think would fit my needs best?
Thanks